Multiple Choice
Which of the graphs below represent y as a function of x?
(a)
 (b)
(b)
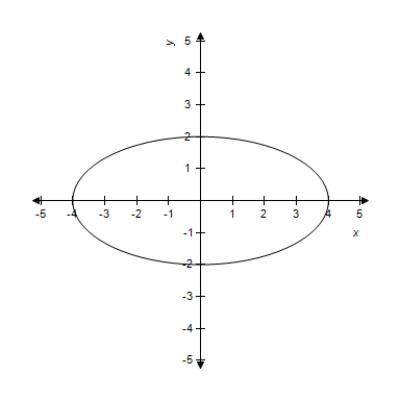
A) only (a)
B) only (b)
C) both (a) and (b)
D) neither (a) nor (b)
Correct Answer:

Verified
Correct Answer:
Verified
Related Questions
Q142: Suppose the percent of U.S. high school
Q143: The percent P of men 65 years
Q144: Use the left-to-right elimination method to solve
Q145: Choose the correct graph of the line
Q146: Solve the equation. <img src="https://d2lvgg3v3hfg70.cloudfront.net/TB1243/.jpg" alt="Solve the
Q148: State the domain and range of the
Q149: Medication A is given every 4 hours
Q150: A retired woman has $130,000 to invest.
Q151: For <img src="https://d2lvgg3v3hfg70.cloudfront.net/TB1243/.jpg" alt="For and
Q152: Write the equation and graph the line