Multiple Choice
The percent P of men 65 years of age or older in the labor force can be modeled by 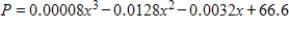 , where x is the number of years past 1890 (Source: U.S. Bureau of the Census) . Plot this function using a graphing utility. What range of x-values and y-values do you need to use to view this graph for the years 1890 to 2010?
A) x-min = 0, x-max = 120 y-min = 0, y-max = 60
B) x-min = -120, x-max = 0 y-min = 0, y-max = 70
C) x-min = -120 , x-max = 120 y-min = 0, y-max = 50
D) x-min = 0, x-max = 90 y-min = 0, y-max = 50
E) x-min = 0, x-max = 120 y-min = 0, y-max = 70
Correct Answer:

Verified
Correct Answer:
Verified
Q138: Is the relation defined by the table
Q139: If 150 feet of fence is to
Q140: Determine whether the following pairs of equations
Q141: Solve the inequality. <img src="https://d2lvgg3v3hfg70.cloudfront.net/TB1243/.jpg" alt="Solve
Q142: Suppose the percent of U.S. high school
Q144: Use the left-to-right elimination method to solve
Q145: Choose the correct graph of the line
Q146: Solve the equation. <img src="https://d2lvgg3v3hfg70.cloudfront.net/TB1243/.jpg" alt="Solve the
Q147: Which of the graphs below represent y
Q148: State the domain and range of the