Multiple Choice
The following tables give the death rates, per 100,000 population, by age for selected years for males and females. If matrix M gives the male data and matrix F gives the female data, find matrix M - F and describe what it means.
Males 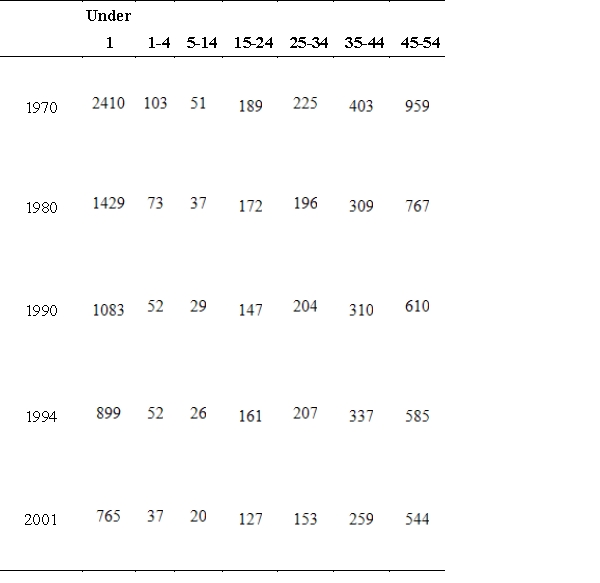 Females
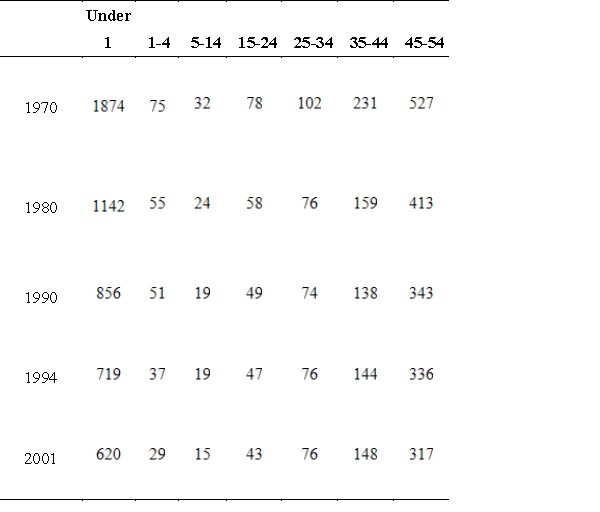
A) 
M - F represents how much greater the numbers are for males in each category per year.
B) 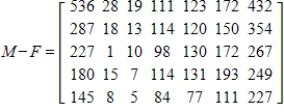
M - F represents how much greater the numbers are for males in each category per year.
C) 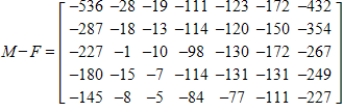
M - F represents how much greater the numbers are for females in each category per year.
D) 
M - F represents how much greater the numbers are for females in each category per year.
E) 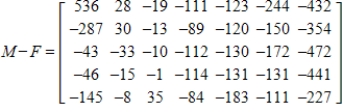
M - F represents only the male death rates, per 100,000 population by age.
Correct Answer:

Verified
Correct Answer:
Verified
Q147: The figure that follows depicts the mean
Q148: A system of linear equations and a
Q149: Using the matrices A and B below,
Q150: A simple economy has an electronic components
Q151: Suppose an economy has two industries, agriculture
Q153: Use the matrices to find <img src="https://d2lvgg3v3hfg70.cloudfront.net/TB1243/.jpg"
Q154: Find the inverse matrix, if one exists.
Q155: Suppose the development department of a firm
Q156: Multiply the matrices. <img src="https://d2lvgg3v3hfg70.cloudfront.net/TB1243/.jpg" alt="Multiply
Q157: A system of equations may have a