Multiple Choice
The figure that follows depicts the mean (average) flow time for a job when the critical-ratio rule is used to dispatch workers at several machines required to complete the job. In the figure, WHN 1, WHN 2, and WHN 3 represent three different rules for determining when a worker should be transferred to another machine, and Where represents six rules for determining the machine to which the worker is transferred. Construct a 3×6 matrix A to represent these data, with entries rounded to the nearest integer. 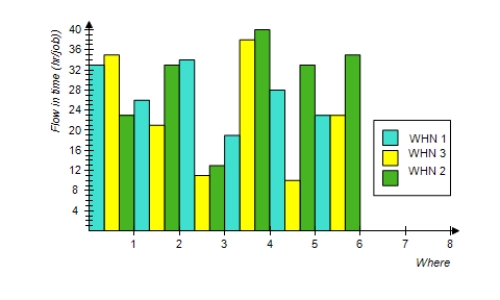
A) 
B) 
C) 
D) 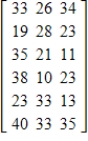
E) 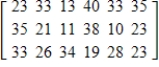
Correct Answer:

Verified
Correct Answer:
Verified
Q142: A car dealer can buy midsize cars
Q143: Suppose the technology matrix for a closed
Q144: A system of equations may have a
Q145: Write the augmented matrix associated with the
Q146: Use row operations on the augmented matrix
Q148: A system of linear equations and a
Q149: Using the matrices A and B below,
Q150: A simple economy has an electronic components
Q151: Suppose an economy has two industries, agriculture
Q152: The following tables give the death rates,