Multiple Choice
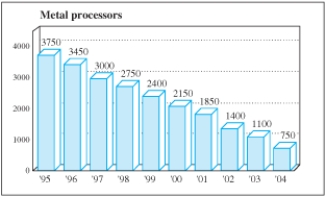
The following figure, from Investor's Business Daily (March 5, 1998) , shows how quickly the U.S. metal processing industry isconsolidating. The linear equation that is the best fit for the number of metal processors as a function of years after 1990 is  , and the best exponential fit is
 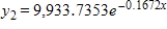 . The linear equation seems to give a much better fit for the data points than the exponential equation. Why then is the exponential equation a more useful model to predict the number of metal processors in
  ?
? 
A) The quantity of metal processing units as a function of time is exponential for the first five years, and linear for the next five years.
B) As the quantity of metal processors decreases, they decrease at an increasingly logarithmic rate as a function of time.
C) The number of metal processing units will probably start to increase in 2007.
D) The linear model gives a negative number of processors in 2010. The exponential model is always non-negative.
E) The number of metal processing units follows a parabolic model.
Correct Answer:

Verified
Correct Answer:
Verified
Q2: The demand function for a certain commodity
Q3: The following table gives the percent of
Q4: Write the equation in logarithmic form.
Q5: The president of a company predicts that
Q6: Solve the exponential equation. Give the answer
Q7: The demand function for a certain commodity
Q8: Graph the function. <img src="https://d2lvgg3v3hfg70.cloudfront.net/TB1243/.jpg" alt="Graph
Q9: Solve the exponential equation. Round your answer
Q10: An initial amount of 300 g of
Q11: The following table gives the percent of