Multiple Choice
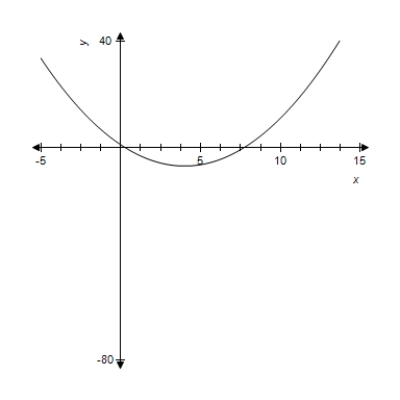
For the given function, use the graph to identify x-values for which  . You may use the derivative to check your conclusion.
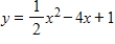
A) 
B) 
C) 
D) 
E) 
Correct Answer:

Verified
Correct Answer:
Verified
Related Questions
Q58: The monthly demand function for x units
Q59: The percent p of impurities that can
Q60: A function and its first and second
Q61: Suppose the average costs of a mining
Q62: The manufacturer of GRIPPER tires modeled its
Q64: A firm can produce 100 units per
Q65: A company needs 300 items per year.
Q66: Use the graph shown in the figure
Q67: For the given function and graph, estimate
Q68: A vacationer on an island 8 miles