Multiple Choice
Use the graph shown in the figure and identify points from A through I that satisfy the given condition.  and
and 
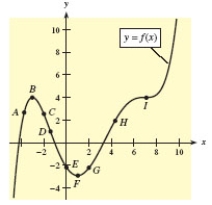
A) I
B) F
C) C
D) D
E) H
Correct Answer:

Verified
Correct Answer:
Verified
Related Questions
Q61: Suppose the average costs of a mining
Q62: The manufacturer of GRIPPER tires modeled its
Q63: For the given function, use the graph
Q64: A firm can produce 100 units per
Q65: A company needs 300 items per year.
Q67: For the given function and graph, estimate
Q68: A vacationer on an island 8 miles
Q69: Analytically determine the location(s) of any vertical
Q70: A travel agency will plan a tour
Q71: Suppose the average costs of a mining