Multiple Choice
The graph in the following figure gives the times that it takes a vehicle to reach speeds from 0 mph to 25 mph, in increments of 5 mph, with a curve connecting them. Count the squares under the curve to estimate this distance. Estimate the distance traveled by the vehicle in 14 seconds, to a speed of 25 mph. (Be careful with time units.) 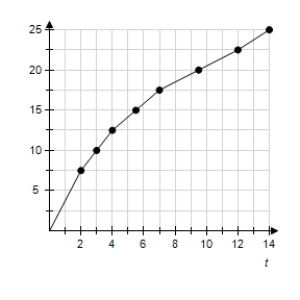
A) 1/16 mile
B) 4/15 mile
C) 1/13 mile
D) 1/9 mile
E) 1/8 mile
Correct Answer:

Verified
Correct Answer:
Verified
Q119: If the supply function for a commodity
Q120: The Carter Car Service franchise has a
Q121: Suppose that the output of the machinery
Q122: The average life for a particular brand
Q123: Use integration by parts to evaluate the
Q125: Use the function <img src="https://d2lvgg3v3hfg70.cloudfront.net/TB1243/.jpg" alt="Use the
Q126: Find the average value of the function
Q127: Find the mean of the probability distribution
Q128: Evaluate the integral <img src="https://d2lvgg3v3hfg70.cloudfront.net/TB1243/.jpg" alt="Evaluate the
Q129: Suppose that the income from a slot