Multiple Choice
Which graph best describes how the vapor pressure of a substance varies with temperature according to the Clausius-Clapeyron equation? ln(P) is plotted on the y-axis, and 1/T is plotted on the x-axis. The origin (0, 0) is not necessarily located where the axes cross. 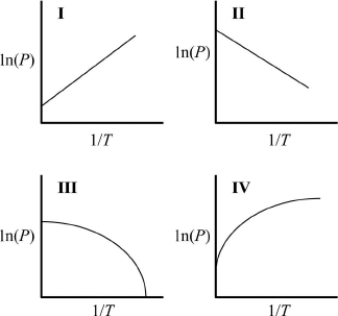
A) I
B) II
C) III
D) IV
Correct Answer:

Verified
Correct Answer:
Verified
Q8: How many moles of solute are there
Q103: The pressure inside a bottle of carbonated
Q107: Which solution will have the lowest osmotic
Q107: In the diagram below, one beaker contains
Q110: The arrow in the diagram below indicates
Q113: Seawater can be characterized by the following
Q114: Calculate the lattice energy of sodium
Q115: The vapor pressure of an aqueous solution
Q116: Henry's law constant (mol/L · atm) for
Q117: Suppose 100.0 mL of a 2.50 mM