Short Answer
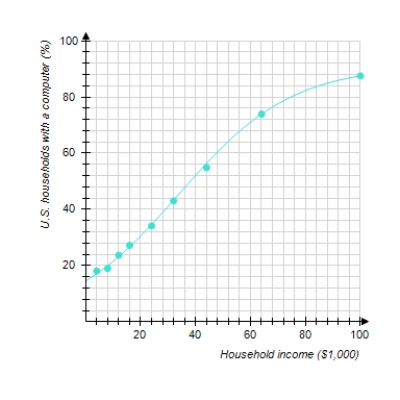
The following graph shows the actual percentage of U.S. households with a computer as a function of household income (the data points) and a logistic model of these data (the curve). The logistic model is
where x is the household income in thousands of dollars. For low incomes, the logistic model is approximately exponential. Which exponential model best approximates P(x) for small x Round the coefficients to the nearest hundredth.
P(x) = ________ ·( ________)x
Correct Answer:

Verified
Correct Answer:
Verified
Q1: Find the associated exponential decay model.<br>
Q3: Model the data using an exponential
Q4: Model the data using an exponential
Q5: The following chart shows the value
Q6: Plutonium-239 is used as a fuel for
Q7: The Better Baby Buggy Co. has
Q8: How long will it take an investment
Q9: The two fraternities Sigma Alpha Mu and
Q10: You are trying to determine the half-life
Q11: You have just opened a new