Multiple Choice
The following chart shows the value of trade between two countries for the period 1994 - 2004 ( represents 1994) . 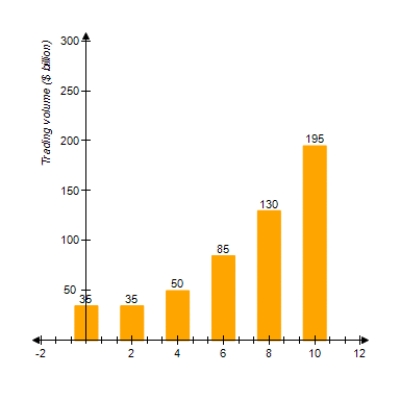
Which of the following models best approximates the data given (Try to answer this without actually computing values.)
A)
B)
C)
D)
E)
Correct Answer:

Verified
Correct Answer:
Verified
Related Questions
Q1: Find the associated exponential decay model.<br>
Q2: The following graph shows the actual
Q3: Model the data using an exponential
Q4: Model the data using an exponential
Q6: Plutonium-239 is used as a fuel for
Q7: The Better Baby Buggy Co. has
Q8: How long will it take an investment
Q9: The two fraternities Sigma Alpha Mu and
Q10: You are trying to determine the half-life
Q11: You have just opened a new