Multiple Choice
Graph shows the number of sports utility vehicles sold in the United States. represents sales in year t in thousands of vehicles. Find . 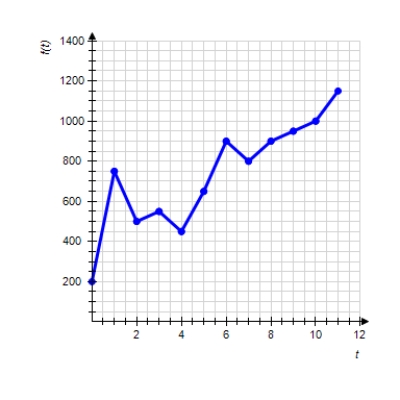
A) 1,000,000
B) 750,000
C) 450,000
D) 1,150,000
E) 950,000
Correct Answer:

Verified
Correct Answer:
Verified
Related Questions
Q123: Decide which of the two given
Q124: Find the coefficient of correlation of
Q125: In the Fahrenheit temperature scale, water freezes
Q126: The height of the falling sheet
Q127: Find the coefficient of correlation of
Q129: In the Fahrenheit temperature scale, water freezes
Q130: Graph shows the number of sports
Q131: The following table shows the approximate
Q132: Following are approximate values of the
Q133: Calculate the slope of the straight