Multiple Choice
Graph shows the number of sports utility vehicles sold in the United States. represents sales in year t in thousands of vehicles. Use the graph to estimate the smallest value of for . 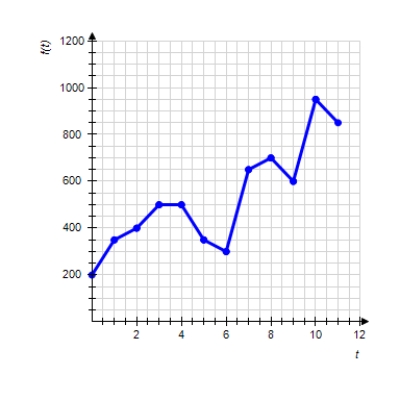
A) 300,000
B) 350,000
C) 850,000
D) 600,000
E) 500,000
Correct Answer:

Verified
Correct Answer:
Verified
Related Questions
Q125: In the Fahrenheit temperature scale, water freezes
Q126: The height of the falling sheet
Q127: Find the coefficient of correlation of
Q128: Graph shows the number of sports
Q129: In the Fahrenheit temperature scale, water freezes
Q131: The following table shows the approximate
Q132: Following are approximate values of the
Q133: Calculate the slope of the straight
Q134: Find the best-fit line associated with
Q135: You can sell 90 pet chias