Multiple Choice
Figure 7.3. World Oil Market 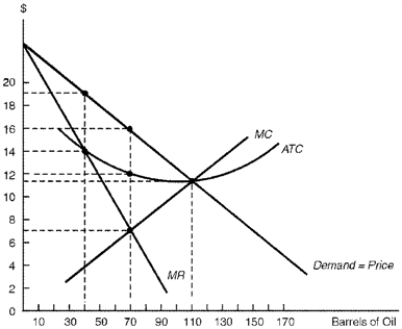
-Consider Figure 7.3.Under a profit-maximizing cartel, the quantity of oil produced equals
A) 40 barrels.
B) 70 barrels.
C) 90 barrels.
D) 110 barrels.
Correct Answer:

Verified
Correct Answer:
Verified
Q120: The diagram below illustrates the international tin
Q121: Which of the following could partially explain
Q122: Import substitution is an example of<br>A) an
Q123: Outward-oriented growth strategies emphasize<br>A) the allocation of
Q124: According to the Generalized System of Preferences
Q126: Efforts to stabilize export prices and revenues
Q127: To prevent the market price of tin
Q128: Figure 7.3. World Oil Market <img src="https://d2lvgg3v3hfg70.cloudfront.net/TB7110/.jpg"
Q129: Export promotion policies attempt to encourage production
Q130: By the 1990s, China had departed from