Multiple Choice
The following figure shows the demand curves for baby formula.Which of the following changes is likely to happen if the price of baby formula increases?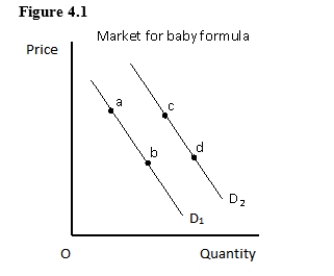
A) A shift in the demand curve from D1 to D2
B) A movement along demand curve D1 from point a to point b
C) A shift in the demand curve from D2 to D1
D) A movement along the demand curve D2 from point d to point c
E) A movement from point b on the demand curve D1 to point c on the demand curve D2
Correct Answer:

Verified
Correct Answer:
Verified
Q75: Sugar and honey are viewed as substitutes
Q121: Figure 4.2 shows the demand curves for
Q122: As the baby boom ended,fewer families had
Q123: Jennifer expects the price of CDs to
Q124: In the figure given below,the number of
Q126: Disequilibrium occurs due to the absence of
Q127: The income effect of a decrease in
Q128: If corn and soybean are alternative crops
Q129: Which of these is likely to increase
Q130: The supply of index cards is likely