Multiple Choice
Figure 4.2 shows the demand curves for a good.A shift from demand curve D' to demand curve D in the figure below would be caused by a(n) :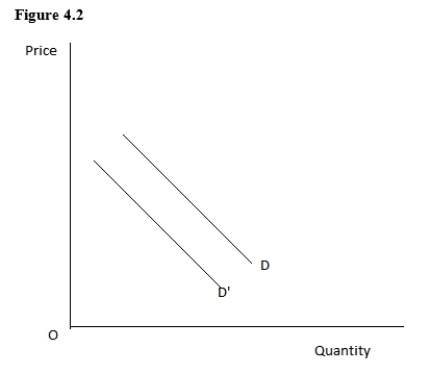
A) increase in the price of the good under consideration.
B) significant decrease in population because of emigration.
C) increase in the price of a substitute good.
D) decrease in the number of producers of the product.
E) decrease in the price of an important resource.
Correct Answer:

Verified
Correct Answer:
Verified
Q75: Sugar and honey are viewed as substitutes
Q116: Which of the following would shift the
Q117: In which of the following situations is
Q118: Two events occur simultaneously in the market
Q119: The table given below shows the
Q122: As the baby boom ended,fewer families had
Q123: Jennifer expects the price of CDs to
Q124: In the figure given below,the number of
Q125: The following figure shows the demand curves
Q126: Disequilibrium occurs due to the absence of