Multiple Choice
The figure below shows the aggregate demand and supply curves for the U.S.In this figure,as the aggregate demand curve shifts from AD to AD',the equilibrium price level in period 1: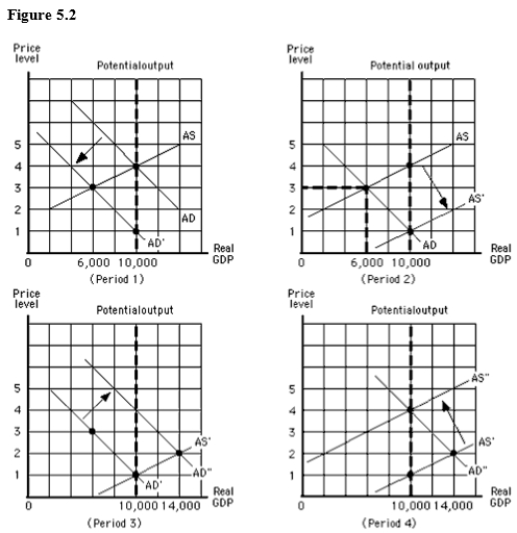
A) increases from 3 to 4.
B) decreases from 4 to 3.
C) decreases from 4 to 1.
D) increases from 1 to 4.
E) decreases from 4 to 2.
Correct Answer:

Verified
Correct Answer:
Verified
Q2: The figure below shows the aggregate demand
Q3: According to John Maynard Keynes' General Theory
Q4: The figure below shows the aggregate demand
Q5: An example of a stock variable in
Q6: Economists use the price index to eliminate
Q8: An increase in wage rate,other things constant,shifts
Q9: Which of these is a likely impact
Q10: Which of these economic changes was observed
Q11: The concept of "invisible hand" introduced by
Q12: A period of sustained decline in output