Multiple Choice
The figure below shows the aggregate demand and supply curves for the U.S.The figure given below shows that the price level changes from _____ when the aggregate supply curve shifts from AS' to AS''.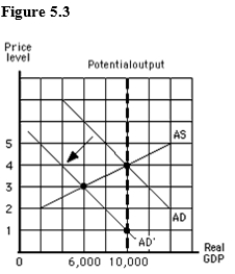
A) 4 to 2
B) 2 to 3
C) 2 to 2
D) 3 to 1
E) 2 to 4
Correct Answer:

Verified
Correct Answer:
Verified
Related Questions
Q1: The laissez-faire approach popular before the Great
Q3: According to John Maynard Keynes' General Theory
Q4: The figure below shows the aggregate demand
Q5: An example of a stock variable in
Q6: Economists use the price index to eliminate
Q7: The figure below shows the aggregate demand
Q8: An increase in wage rate,other things constant,shifts
Q9: Which of these is a likely impact
Q10: Which of these economic changes was observed
Q11: The concept of "invisible hand" introduced by