Multiple Choice
The figure below shows the short-run aggregate demand and supply curves of an economy.If the economy is currently producing at Y2,long-run equilibrium will most likely be established by a(n) :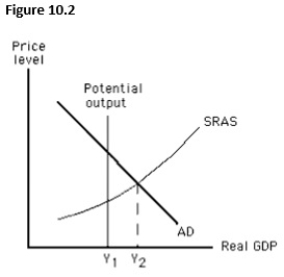
A) increase in short-run aggregate supply.
B) decrease in short-run aggregate supply.
C) decrease in potential output.
D) increase in potential output.
E) rightward shift of the aggregate demand curve.
Correct Answer:

Verified
Correct Answer:
Verified
Q48: When actual output increases the potential output,_.<br>A)more
Q49: An adverse supply shock generally decreases the
Q50: During a particular year,nominal wages increased by
Q51: When the economy is at its potential
Q52: The fact that some resource prices are
Q54: The figure below shows the determination of
Q55: Stagflation is defined as:<br>A)decreased output accompanied by
Q56: The figure below shows short-run equilibrium in
Q57: If the price level increases by 5
Q58: Which of the following is most likely