Multiple Choice
The figure below shows the determination of the equilibrium price level and real GDP in an aggregate demand-aggregate supply model.The movement shown in this figure is most likely to be caused by: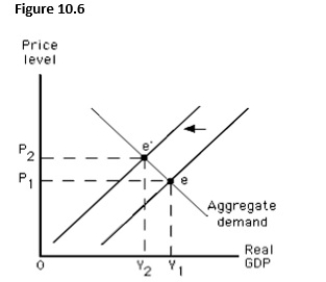
A) a decrease in the real wage.
B) an increase in the economy's capital stock.
C) the actions of a labor union.
D) a decrease in consumer spending.
E) an increase in labor productivity.
Correct Answer:

Verified
Correct Answer:
Verified
Q49: An adverse supply shock generally decreases the
Q50: During a particular year,nominal wages increased by
Q51: When the economy is at its potential
Q52: The fact that some resource prices are
Q53: The figure below shows the short-run aggregate
Q55: Stagflation is defined as:<br>A)decreased output accompanied by
Q56: The figure below shows short-run equilibrium in
Q57: If the price level increases by 5
Q58: Which of the following is most likely
Q59: Which of the following if true would