Multiple Choice
The figure below shows equilibrium in an aggregate demand-aggregate supply model.In this figure,the shift from AS to AS' is likely to occur when: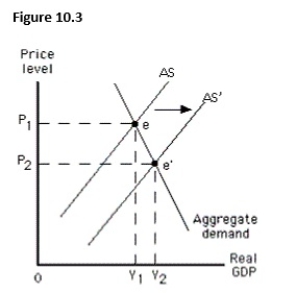
A) the actual price level is higher than expected.
B) the actual price level is lower than expected.
C) the unemployment rate is lower than the natural rate.
D) the actual output is more than the potential output.
E) the aggregate demand curve intersects the short-run aggregate supply curve at the potential output.
Correct Answer:

Verified
Correct Answer:
Verified
Q16: Which of the following is true when
Q17: The figure below shows equilibrium in an
Q18: The potential output of an economy is:<br>A)the
Q19: The actual price level is assumed to
Q20: When the actual price level in an
Q22: Which of the following occurs when an
Q23: Which of these is not a beneficial
Q24: Which of the following is most likely
Q25: The international oil price hike by OPEC
Q26: The figure given below depicts long-run equilibrium