Multiple Choice
The figure given below depicts long-run equilibrium in the aggregate demand-aggregate supply model.Which of the following changes is depicted by the movement from Y1 to Y2?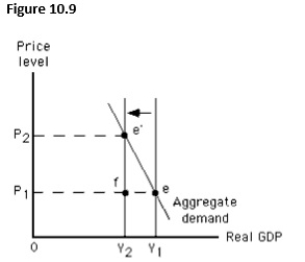
A) An increase in long-run aggregate supply
B) An increase in short-run aggregate supply
C) A decrease in short-run aggregate supply
D) A decrease in long-run aggregate supply
E) An increase in the aggregate quantity demanded
Correct Answer:

Verified
Correct Answer:
Verified
Q21: The figure below shows equilibrium in an
Q22: Which of the following occurs when an
Q23: Which of these is not a beneficial
Q24: Which of the following is most likely
Q25: The international oil price hike by OPEC
Q27: The real wage is equal to the:<br>A)wage
Q28: The figure given below depicts long run
Q29: Suppose an economy is initially in long-run
Q30: An expansionary gap is equal to:<br>A)real GDP
Q31: In the long run,a leftward shift of