Multiple Choice
The figure below shows short-run equilibrium in an aggregate demand-aggregate supply model.In this figure,the distance between points Y1 and Y2 represents: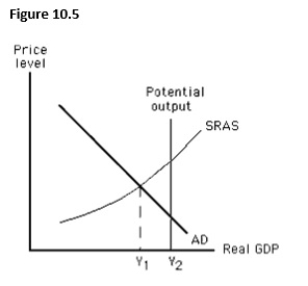
A) an expansionary gap.
B) a recessionary gap.
C) the potential output.
D) seasonal unemployment.
E) structural unemployment.
Correct Answer:

Verified
Correct Answer:
Verified
Q29: Suppose an economy is initially in long-run
Q30: An expansionary gap is equal to:<br>A)real GDP
Q31: In the long run,a leftward shift of
Q32: Given the aggregate demand curve,an increase in
Q33: The short-run aggregate supply curve:<br>A)is positively sloped.<br>B)is
Q35: The figure given below depicts long-run equilibrium
Q36: Which of these is an advantage of
Q37: An expansionary gap in the short-run results
Q38: The slope of the short-run aggregate supply
Q39: The nominal cost per unit of output