Multiple Choice
The figure given below depicts long-run equilibrium in the aggregate demand-aggregate supply model.The movement from Y1 to Y2in this figure could have been caused by a: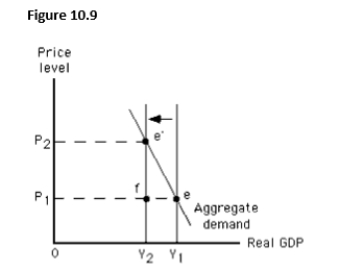
A) decrease in the size of the labor force.
B) decrease in the price level.
C) positive level of net investment.
D) increase in autonomous consumption.
E) decrease in autonomous consumption.
Correct Answer:

Verified
Correct Answer:
Verified
Q30: An expansionary gap is equal to:<br>A)real GDP
Q31: In the long run,a leftward shift of
Q32: Given the aggregate demand curve,an increase in
Q33: The short-run aggregate supply curve:<br>A)is positively sloped.<br>B)is
Q34: The figure below shows short-run equilibrium in
Q36: Which of these is an advantage of
Q37: An expansionary gap in the short-run results
Q38: The slope of the short-run aggregate supply
Q39: The nominal cost per unit of output
Q40: Wage rates are typically flexible upward but