Multiple Choice
The figure given below shows equilibrium in a money market.Which of the following will be observed if the money supply curve shifts from S to S* while the rate of interest remains at "r?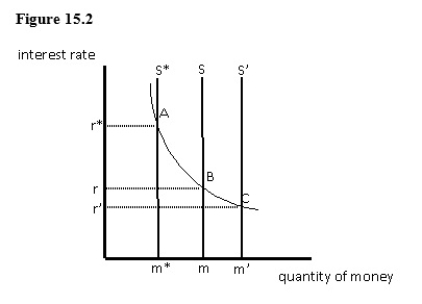
A) There will be an excess demand for money.
B) There will be an excess supply of money.
C) The Fed will sell U.S.Treasury securities.
D) The money market equilibrium will move from point B to point C.
E) The money market equilibrium will move from point C to point A.
Correct Answer:

Verified
Correct Answer:
Verified
Q97: The Dodd-Frank Act gave the Fed and
Q98: Movements along a money demand curve reflect
Q99: The figure given below depicts short-run equilibrium
Q100: An increase in the money supply leads
Q101: Over the past 40 years,the most frequent
Q103: For monetary policy to be effective in
Q104: Other things constant,an increase in the price
Q105: If the Fed purchases U.S.government securities,gross domestic
Q106: Which of these is an advantage of
Q107: The figure given below shows the aggregate