Multiple Choice
The figure given below shows the aggregate demand curve and the short-run aggregate supply curve of an economy.In this figure,short-run equilibrium occurs at: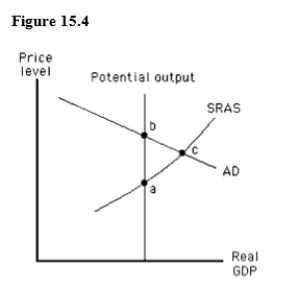
A) point b,where actual output exceeds potential output.
B) point a,where actual output exceeds potential output.
C) point c,where actual price level exceeds the expected price level.
D) point c,where the actual price level is less than the expected price level.
E) point b,where the actual price level exceeds the expected price level.
Correct Answer:

Verified
Correct Answer:
Verified
Q102: The figure given below shows equilibrium in
Q103: For monetary policy to be effective in
Q104: Other things constant,an increase in the price
Q105: If the Fed purchases U.S.government securities,gross domestic
Q106: Which of these is an advantage of
Q108: If the money supply in an economy
Q109: If interest rates are to remain constant,the
Q110: Which of the following is true of
Q111: Which of the following is an example
Q112: A decrease in the money supply in