Multiple Choice
The following graph shows the market equilibrium for corn in the United States.If the world price of corn is $2 and there are no trade restrictions,the United States will: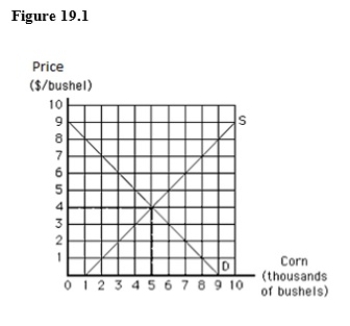
A) produce 3,000 bushels of corn,consume 7,000 bushels of corn,and import 4,000 bushels of corn.
B) produce 3,000 bushels of corn,consume 7,000 bushels of corn,and export 4,000 bushels of corn.
C) have an excess supply of corn.
D) produce 7,000 bushels of corn.
E) produce 5,000 bushels of corn,consume 7,000 bushels of corn,and import 2,000 bushels of corn.
Correct Answer:

Verified
Correct Answer:
Verified
Q38: An effective import quota:<br>A)lowers the price of
Q39: Quotas are favoured over free international trade
Q40: Which of the following is not a
Q41: In the case of declining industries,wage subsidies
Q42: The following graph shows the supply of
Q44: The basis of the benefits of specialization
Q45: The following table shows per-day production
Q46: The following table shows the demand,supply,and
Q47: The following image shows the market for
Q123: If a country has an absolute advantage