Multiple Choice
The following graph shows the supply of and demand for baseballs in the United States.If the world price is $3 per baseball and a tariff of $1 per baseball is imposed,then the tariff revenue collected by the United States government is _____.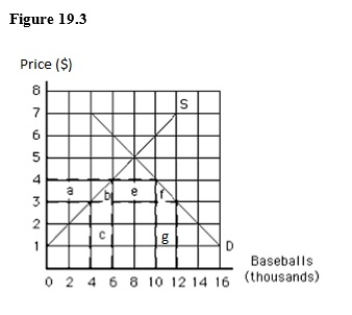
A) $4,000
B) $16,000
C) $20,000
D) $24,000
E) $48,000
Correct Answer:

Verified
Correct Answer:
Verified
Q37: For each pound of blueberry cheesecake Abura
Q38: An effective import quota:<br>A)lowers the price of
Q39: Quotas are favoured over free international trade
Q40: Which of the following is not a
Q41: In the case of declining industries,wage subsidies
Q43: The following graph shows the market equilibrium
Q44: The basis of the benefits of specialization
Q45: The following table shows per-day production
Q46: The following table shows the demand,supply,and
Q47: The following image shows the market for