menu-iconExamlexExamLexServices

Discover

Ask a Question
  1. All Topics
  2. Topic
    Business
  3. Study Set
    Macroeconomics A Contemporary Introduction Study Set 1
  4. Exam
    Exam 17: International Trade
  5. Question
    The Following Graph Shows the Supply of and Demand for Baseballs
Solved

The Following Graph Shows the Supply of and Demand for Baseballs

Question 128

Question 128

Multiple Choice

The following graph shows the supply of and demand for baseballs in the United States.If the world price is $3 per baseball,then _____ baseballs are imported.
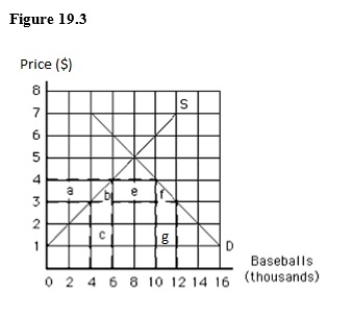
The following graph shows the supply of and demand for baseballs in the United States.If the world price is $3 per baseball,then _____ baseballs are imported.   A) 4,000 B) 6,000 C) 8,000 D) 10,000 E) 12,000


A) 4,000
B) 6,000
C) 8,000
D) 10,000
E) 12,000

Correct Answer:

verifed

Verified

Unlock this answer now
Get Access to more Verified Answers free of charge

Related Questions

Q34: Whenever the opportunity costs of goods are

Q36: It is possible for one country to

Q123: The following graph shows the supply of

Q124: When a country imposes trade restrictions,the domestic

Q127: A World Trade Organization (WTO)member country must

Q129: Which of the following results in international

Q130: In a two-country,two-commodity framework,when one country has

Q131: Suppose Aharoni and Kalinga are the

Q132: A charge levied on imports in terms

Q133: The consumption possibilities frontier shows:<br>A)a nation's possible

Examlex

ExamLex

About UsContact UsPerks CenterHomeschoolingTest Prep

Work With Us

Campus RepresentativeInfluencers

Links

FaqPricingChrome Extension

Download The App

Get App StoreGet Google Play

Policies

Privacy PolicyTerms of ServiceHonor CodeCommunity Guidelines

Scan To Download

qr-code

Copyright © (2025) ExamLex LLC.

Privacy PolicyTerms Of ServiceHonor CodeCommunity Guidelines