Multiple Choice
The following graph shows the supply of and demand for baseballs in the United States.If the world price is $3 per baseball and a tariff of $1 per baseball is imposed,then the number of baseballs purchased in the United States is _____.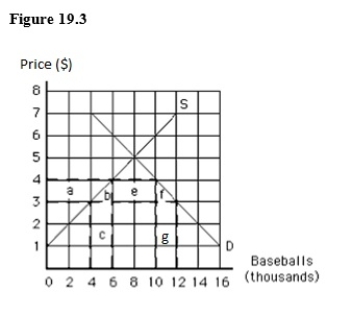
A) 4,000
B) 6,000
C) 8,000
D) 10,000
E) 12,000
Correct Answer:

Verified
Correct Answer:
Verified
Q34: Whenever the opportunity costs of goods are
Q36: It is possible for one country to
Q118: The industry for computers has just started
Q119: The production possibilities curve of a country
Q120: An import quota is a tax on
Q121: If production is subject to economies of
Q122: The declining industries argument was formulated as
Q124: When a country imposes trade restrictions,the domestic
Q127: A World Trade Organization (WTO)member country must
Q128: The following graph shows the supply of