Multiple Choice
The following graph shows the supply of and demand for baseballs in the United States.If the world price is $3 per baseball and a tariff of $1 per baseball is imposed,then the number of baseballs imported is _____.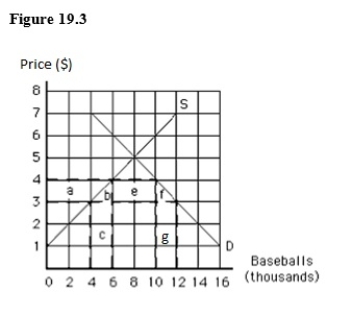
A) 4,000
B) 6,000
C) 8,000
D) 10,000
E) 12,000
Correct Answer:

Verified
Correct Answer:
Verified
Q24: If a tariff increases, everybody loses except
Q72: Quotas and tariffs discourage foreign governments from
Q116: A tariff is a tax on either
Q141: The following image shows the market for
Q143: The following table shows the demand,supply,and
Q144: If a country has an absolute advantage
Q145: The General Agreement on Tariffs and Trade
Q146: For each watch Marina produces,it gives up
Q148: Which of the following was one of
Q149: The following table shows per-day production