Multiple Choice
The following graph shows the supply of and demand for baseballs in the United States.If the world price is $3 per baseball and a tariff of $1 per baseball is imposed,the net welfare loss of the tariff is shown by the area _____.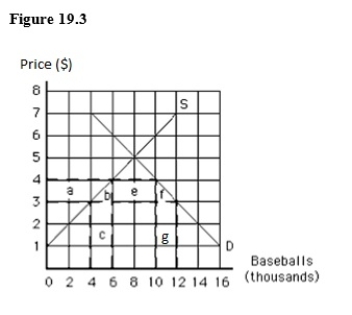
A) g
B) c
C) a
D) c and g
E) b and f
Correct Answer:

Verified
Correct Answer:
Verified
Related Questions
Q95: The following graph shows the supply of
Q97: Japan is generally considered a closed economy.
Q98: The American Tire Company has been experiencing
Q99: Which of the following does not result
Q101: Which of the following reasons explains why
Q102: The following graph shows the demand for
Q103: When a country imposes a per-unit tariff
Q104: Ad valorem tariffs on imports are based
Q105: Which of the following is not an
Q168: If the United States has an absolute