Multiple Choice
The following graph shows the demand for and domestic supply of a good in a country.If the world price of the good is $2.00 per unit and an import quota of 50 units per month is imposed,then the gain of the foreign exporters with quota rights is represented by the area _____.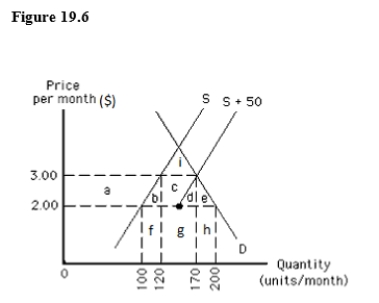
A) h
B) i
C) g
D) a and b
E) c and d
Correct Answer:

Verified
Correct Answer:
Verified
Q97: Japan is generally considered a closed economy.
Q98: The American Tire Company has been experiencing
Q99: Which of the following does not result
Q100: The following graph shows the supply of
Q101: Which of the following reasons explains why
Q103: When a country imposes a per-unit tariff
Q104: Ad valorem tariffs on imports are based
Q105: Which of the following is not an
Q106: The following table shows the demand,supply,and
Q107: If there are no trade restrictions,a country