Essay
A statistics course at a large university is taught in each semester. A student has noticed that the students in semester 1 and semester 2 are enrolled in different degrees. To investigate, the student takes a random sample of 25 students from semester 1 and 25 students from semester 2 and records their final marks (%) provided in the table below. Excel was used to generate descriptive statistics on each sample.
Assume that student final marks are normally distributed in each semester. 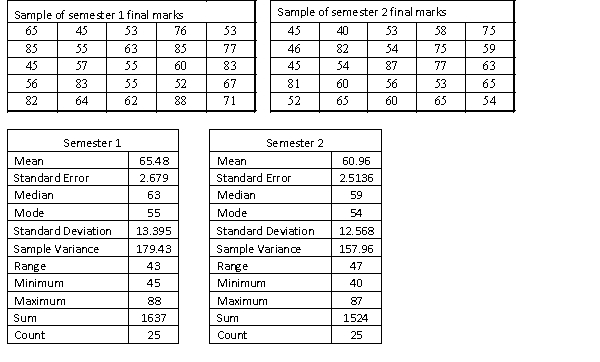 Estimate and interpret a 95% confidence interval for the population average final mark for semester 2 students.
Correct Answer:

Verified
60.96 ± 2.064(2.5136) = (55.77...View Answer
Unlock this answer now
Get Access to more Verified Answers free of charge
Correct Answer:
Verified
View Answer
Unlock this answer now
Get Access to more Verified Answers free of charge
Q63: The number of degrees of freedom associated
Q64: There are different approaches to fitness
Q65: The equal-variances test statistic of
Q66: Which of the following statements is
Q67: For a sample of 25 observations taken
Q69: If a sample has 20 observations
Q70: A statistics course at a large university
Q71: A statistics course at a large university
Q72: The pooled-variance estimator, <span class="ql-formula"
Q73: Both the equal-variances and unequal-variances t-test