Essay
A statistics course at a large university is taught in each semester. A student has noticed that the students in semester 1 and semester 2 are enrolled in different degrees. To investigate, the student takes a random sample of 25 students from semester 1 and 25 students from semester 2 and records their final marks (%) provided in the table below. Excel was used to generate descriptive statistics on each sample.
Assume that student final marks are normally distributed in each semester. 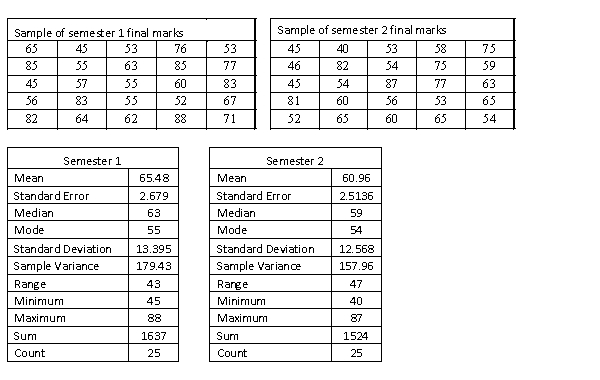 (a) Can we conclude at the 5% level of significance that over 40% of students in the population scored a pass grade in semester 1, where a pass grade is 50% to 64%?
(b) Find the p-value of the test and briefly explain how to use it to test the hypotheses.
Correct Answer:

Verified
(a) p hat = sample proportion in semeste...View Answer
Unlock this answer now
Get Access to more Verified Answers free of charge
Correct Answer:
Verified
View Answer
Unlock this answer now
Get Access to more Verified Answers free of charge
Q65: The equal-variances test statistic of
Q66: Which of the following statements is
Q67: For a sample of 25 observations taken
Q68: A statistics course at a large university
Q69: If a sample has 20 observations
Q71: A statistics course at a large university
Q72: The pooled-variance estimator, <span class="ql-formula"
Q73: Both the equal-variances and unequal-variances t-test
Q74: There are different approaches to fitness
Q75: Suppose that a one-tail t-test is being