Multiple Choice
Figure 21-3
In each case, the budget constraint moves from BC-1 to BC-2. 
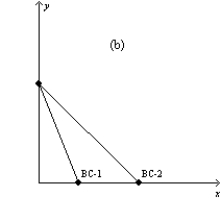
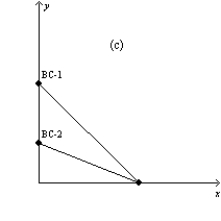
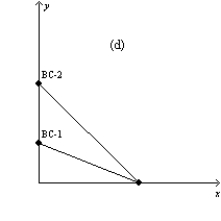
-Refer to Figure 21-3. Which of the graphs in the figure reflects a decrease in the price of good X only?
A) graph a
B) graph b
C) graph c
D) graph d
Correct Answer:

Verified
Correct Answer:
Verified
Q14: The indifference curves for nickels and dimes
Q57: When two goods are perfect substitutes, the<br>A)indifference
Q58: The income effect of an increase in
Q59: Figure 21-20<br>The following graph illustrates a representative
Q60: When the price of a normal good
Q62: If an indifference curve is bowed out
Q65: When two goods are perfect substitutes, the
Q66: Figure 21-7 <img src="https://d2lvgg3v3hfg70.cloudfront.net/TB1273/.jpg" alt="Figure 21-7
Q78: What is significant about a point on
Q177: What does the slope of a budget