Multiple Choice
A time series plot of a period of time (in weeks) verses sales (in 1,000's of gallons) is shown below. Which of the following data patterns best describes the scenario shown? 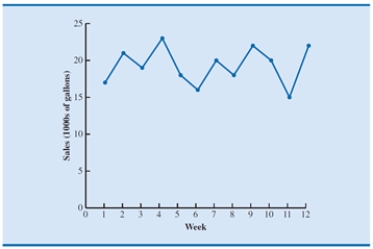
A) Time series with a linear trend pattern
B) Time series with a nonlinear trend pattern
C) Time series with no pattern
D) Time series with a horizontal pattern
Correct Answer:

Verified
Correct Answer:
Verified
Q5: The monthly market shares of General
Q6: A time series plot of a period
Q7: The following data shows the quarterly
Q13: Which is not true regarding trend patterns?<br>A)Can
Q14: Consider the following time series.
Q15: Consider the following time series data:
Q18: If the forecasted value of the time
Q34: Which of the following states the objective
Q39: The moving averages and exponential smoothing methods
Q40: A time series with a seasonal pattern