Multiple Choice
A time series plot of a period of time (in months) verses sales (in number of units) is shown below. Which of the following data patterns best describes the scenario shown? 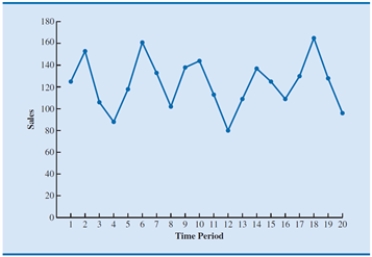
A) Linear trend pattern
B) Logarithmic trend
C) Exponential trend
D) Seasonal pattern
Correct Answer:

Verified
Correct Answer:
Verified
Related Questions
Q1: Demand for a product and the
Q2: Consider the following time series data.
Q4: The following times series shows the
Q5: The monthly market shares of General
Q7: The following data shows the quarterly
Q10: A time series plot of a period
Q13: Which is not true regarding trend patterns?<br>A)Can
Q24: An exponential trend pattern occurs when<br>A)the amount
Q34: Which of the following states the objective
Q40: A time series with a seasonal pattern