Multiple Choice
The scatter chart below displays the residuals verses the dependent variable, x. Which of the following conclusions can be drawn from the scatter chart given below? 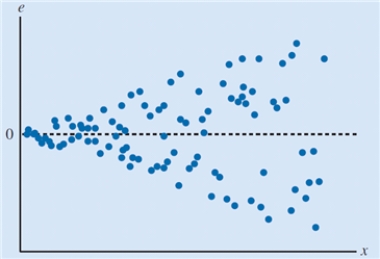
A) The residuals have a increasing variance as the dependent variable increases.
B) The model captures the relationship between the variables accurately.
C) The regression model follows the standard normal probability distribution.
D) The residual distribution is consistently scattered about zero.
Correct Answer:

Verified
Correct Answer:
Verified
Q1: In the simple linear regression model, the
Q47: A student is interested in studying
Q48: The scatter chart below displays the residuals
Q49: A research center is interested in
Q50: Regression analysis involving one dependent variable and
Q53: A researcher wanted to study effect
Q54: Give an estimated simple linear regression
Q55: Prediction of the mean value of the
Q56: A researcher wanted to study effect
Q57: The scatter chart below displays the residuals