Multiple Choice
The scatter chart below displays the residuals verses the dependent variable, t. Which of the following conclusions can be drawn based upon this scatter chart? 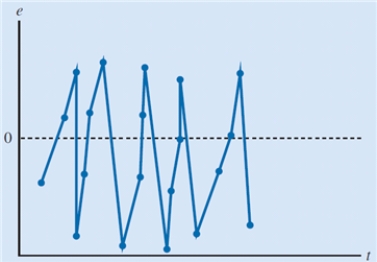
A) model is time-invariant.
B) model captures the relationship between the variables accurately.
C) residuals are not independent.
D) residuals are normally distributed.
Correct Answer:

Verified
Correct Answer:
Verified
Q12: In a linear regression model, the variable
Q17: When the mean value of the dependent
Q52: The scatter chart below displays the residuals
Q53: A researcher wanted to study effect
Q54: Give an estimated simple linear regression
Q55: Prediction of the mean value of the
Q56: A researcher wanted to study effect
Q59: Given the partial Excel output from
Q60: The data listed below is the
Q61: Listed below is a company's sales