Multiple Choice
This Excel bar chart displays the demographics of a Business Analysis class. Approximately how many students are in the class? 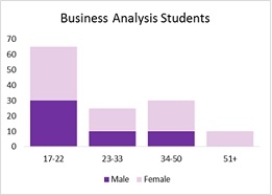
A) 15
B) 50
C) 105
D) 30
Correct Answer:

Verified
Correct Answer:
Verified
Related Questions
Q10: DJ needs to display data over time.
Q22: A time series plot is also known
Q40: The best way to differentiate chart elements
Q58: A research was conducted on a
Q59: This pie chart describes the age frequencies
Q60: The following table is an example
Q64: The data on the distance walked
Q65: A consumer electronics company, after three
Q66: The project lead in an MNC decides
Q68: DJ needs to display data over time.