Essay
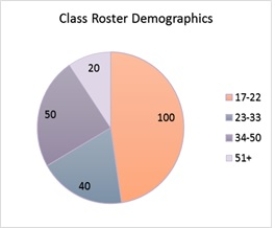
This pie chart describes the age frequencies of students in a Business Analysis class. What is the relative frequency of students who are younger than 23? (Round to a whole number if necessary.)
Correct Answer:

Verified
48
 100/...
View Answer
Unlock this answer now
Get Access to more Verified Answers free of charge
Correct Answer:
Verified
48
100/...
View Answer
Unlock this answer now
Get Access to more Verified Answers free of charge
Related Questions
Q5: A _ is used for examining data
Q10: DJ needs to display data over time.
Q28: A _ is a graphical presentation of
Q40: The best way to differentiate chart elements
Q42: An alternative for a stacked column chart
Q54: Natalie needs to compare the number of
Q58: A research was conducted on a
Q60: The following table is an example
Q63: This Excel bar chart displays the demographics
Q64: The data on the distance walked