Multiple Choice
Figure: Demand Elasticities 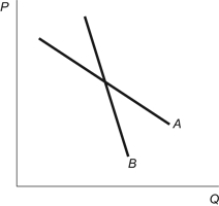 Refer to the figure. It shows two different demand curves. Based on the graph, which statement is TRUE?
A) Elasticity of demand equals the slope of the curve so demand curve A is more elastic.
B) Elasticity of demand equals the slope of the curve so demand curve B is more elastic.
C) Since these two linear demand curves run through a common point we can say that at any given quantity, demand curve A is more elastic than curve B.
D) We cannot infer anything about elasticity from this diagram because slope does not equal elasticity.
Correct Answer:

Verified
Correct Answer:
Verified
Q22: Which of the following explains why local
Q70: Figure: Supply Elasticity <img src="https://d2lvgg3v3hfg70.cloudfront.net/TB33781/.jpg" alt="Figure: Supply
Q71: Assume that demand increases by 1 percent,
Q77: Consider the markets for prescription blood pressure
Q95: Why do revenues increase when producers decrease
Q139: Good X and Good Y are related
Q152: A new per unit subsidy for hybrid
Q184: In an effort to decrease carbon emissions
Q208: Which statement about the computer chip market
Q249: Increases in farm productivity have lowered the