Multiple Choice
Figure: Supply Elasticity 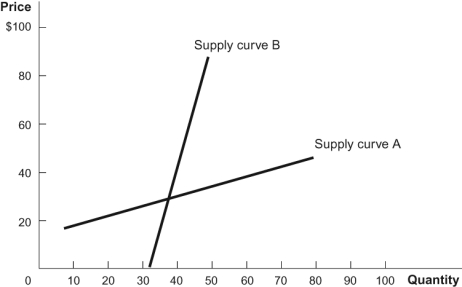 Refer to the figure. It shows two different supply curves. Based on the graph, which statement is TRUE?
A) The same price increase would cause a bigger increase in the quantity supplied along curve A.
B) The same price increase would cause a bigger increase in the quantity supplied along curve B.
C) Curve A reflects a less responsive supply.
D) If comparing responsiveness from a common point, like the intersection, we can conclude that supply curve B is more elastic.
Correct Answer:

Verified
Correct Answer:
Verified
Q22: Which of the following explains why local
Q44: If the price of a good increases
Q68: Figure: Demand Elasticities <img src="https://d2lvgg3v3hfg70.cloudfront.net/TB33781/.jpg" alt="Figure: Demand
Q71: Assume that demand increases by 1 percent,
Q77: Consider the markets for prescription blood pressure
Q95: Why do revenues increase when producers decrease
Q139: Good X and Good Y are related
Q152: A new per unit subsidy for hybrid
Q179: The demand curve for oil is inelastic,
Q184: In an effort to decrease carbon emissions