menu-iconExamlexExamLexServices

Discover

Ask a Question
  1. All Topics
  2. Topic
    Business
  3. Study Set
    Modern Principles of Economics
  4. Exam
    Exam 3: Supply and Demand
  5. Question
    Figure: Supply Shift in the Figure, a Movement from S<sub>1</sub>
Solved

Figure: Supply Shift in the Figure, a Movement from S1

Question 130

Question 130

Multiple Choice

Figure: Supply Shift Figure: Supply Shift   In the figure, a movement from S<sub>1</sub> to S<sub>2</sub> represents: A)  a decrease in supply. B)  an increase in supply. C)  a decrease in quantity supplied. D)  an increase in quantity supplied. 
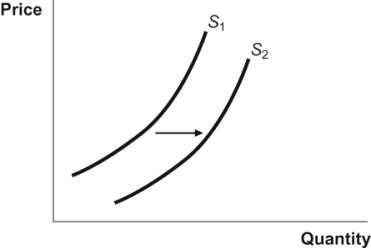
In the figure, a movement from S1 to S2 represents:


A) a decrease in supply.
B) an increase in supply.
C) a decrease in quantity supplied.
D) an increase in quantity supplied.

Correct Answer:

verifed

Verified

Unlock this answer now
Get Access to more Verified Answers free of charge

Related Questions

Q41: There are 100 consumers, each of whom

Q73: Demand for a good or service increases

Q123: New production technology in the manufacture of

Q128: Table: Maximum Willingness to Pay

Q144: A firm produces volleyballs and soccer balls.

Q164: When the price of a good goes

Q176: A change in which factor would shift

Q180: If the university president valued a parking

Q196: A decrease in expected future supply of

Q220: Use the following to answer questions:<br>Figure: Supply

Examlex

ExamLex

About UsContact UsPerks CenterHomeschoolingTest Prep

Work With Us

Campus RepresentativeInfluencers

Links

FaqPricingChrome Extension

Download The App

Get App StoreGet Google Play

Policies

Privacy PolicyTerms of ServiceHonor CodeCommunity Guidelines

Scan To Download

qr-code

Copyright © (2025) ExamLex LLC.

Privacy PolicyTerms Of ServiceHonor CodeCommunity Guidelines