Multiple Choice
Use the following to answer questions:
Figure: Supply Shift 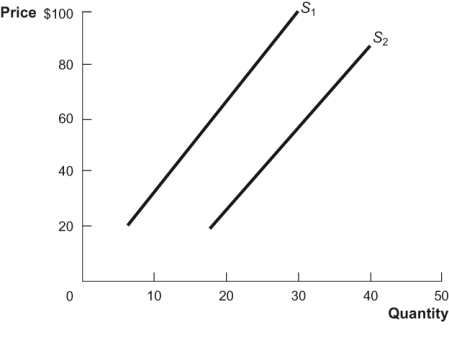
-(Figure: Supply Shift) What would cause the supply curve to shift from S1 to S2 as shown in the diagram?
A) an increase in taxes on firms' output
B) an increase in the price of inputs used to produce the output
C) a decrease in the number of firms that produce the output
D) a decrease in the wages paid to union workers who produce the output
Correct Answer:

Verified
Correct Answer:
Verified
Q215: Use the following to answer questions:<br>Figure: Supply
Q216: What are factors that shift the demand
Q217: An increase in the price of a
Q218: Advertising, fads, and fashion are examples of
Q219: If golf course fees decrease, the demand
Q221: Figure: Shifting Demand <img src="https://d2lvgg3v3hfg70.cloudfront.net/TB3377/.jpg" alt="Figure: Shifting
Q222: To economists, the term consumer surplus means:<br>A)
Q223: A recent explosion in the demand for
Q224: Figure: Demand Curve <img src="https://d2lvgg3v3hfg70.cloudfront.net/TB3377/.jpg" alt="Figure: Demand
Q225: Figure: Supply Shift <img src="https://d2lvgg3v3hfg70.cloudfront.net/TB3377/.jpg" alt="Figure: Supply