Multiple Choice
Exhibit 5-1 Demand curve
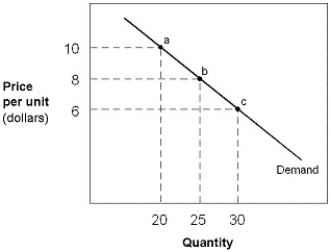
-In Exhibit 5-1, between points a and b, the price elasticity of demand measures:
A) 0.67.
B) 1.5.
C) 2.0.
D) 1.56.
E) 1.0.
Correct Answer:

Verified
Correct Answer:
Verified
Related Questions
Q48: If the federal government placed a 50
Q241: Suppose that the quantity of apples sold
Q242: In response to a price change for
Q243: Exhibit 5-8 Supply and demand curves for
Q244: In order to prove that Dr. Pepper
Q245: Exhibit 5-1 Demand curve<br> <img src="https://d2lvgg3v3hfg70.cloudfront.net/TB6121m/.jpg" alt="Exhibit
Q247: Exhibit 5-7 Demand curve for concert tickets<br>
Q248: A horizontal demand curve indicates perfectly elastic
Q249: If the government wants to raise tax
Q251: Which of the following pairs is most