Multiple Choice
Exhibit 5-8 Supply and demand curves for good X
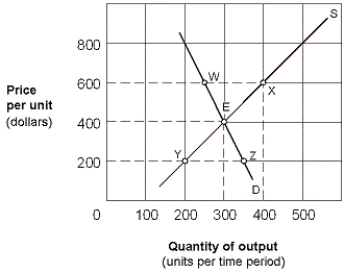
-As shown in Exhibit 5-8, the price elasticity of demand for good X between points E and Z is:
A) 3/13 = 0.23.
B) 13/3 = 4.33.
C) 1/3 = 0.33.
D) 1.
Correct Answer:

Verified
Correct Answer:
Verified
Q107: Suppose the president of a college argues
Q143: Suppose the president of a textbook publisher
Q239: If a good is inferior in an
Q241: Suppose that the quantity of apples sold
Q242: In response to a price change for
Q244: In order to prove that Dr. Pepper
Q245: Exhibit 5-1 Demand curve<br> <img src="https://d2lvgg3v3hfg70.cloudfront.net/TB6121m/.jpg" alt="Exhibit
Q246: Exhibit 5-1 Demand curve<br> <img src="https://d2lvgg3v3hfg70.cloudfront.net/TB6121m/.jpg" alt="Exhibit
Q247: Exhibit 5-7 Demand curve for concert tickets<br>
Q248: A horizontal demand curve indicates perfectly elastic