Multiple Choice
Exhibit 3-3 Demand curves 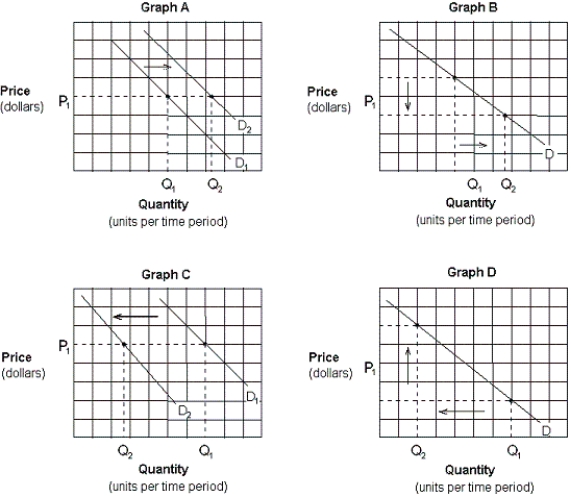
-Which of the graphs in Exhibit 3-3 depicts the effect of an increase in income on the demand for DVDs (a normal good) ?
A) Graph A.
B) Graph B.
C) Graph C.
D) Graph D.
Correct Answer:

Verified
Correct Answer:
Verified
Related Questions
Q68: An increase in the demand for a
Q402: Exhibit 3-2 Demand curves<br> <img src="https://d2lvgg3v3hfg70.cloudfront.net/TB6121m/.jpg" alt="Exhibit
Q403: Market equilibrium is:<br>A) defined as the
Q404: The law of demand refers to the:<br>A)
Q405: Producer surplus is the:<br>A) number of producers
Q406: If the demand for a good increases
Q407: A shortage occurs when the quantity demanded
Q408: Exhibit 3-16 Supply and demand curves
Q409: An increase in the number of producers
Q411: The most plausible reason why changes in