Multiple Choice
Exhibit 3-3 Demand curves 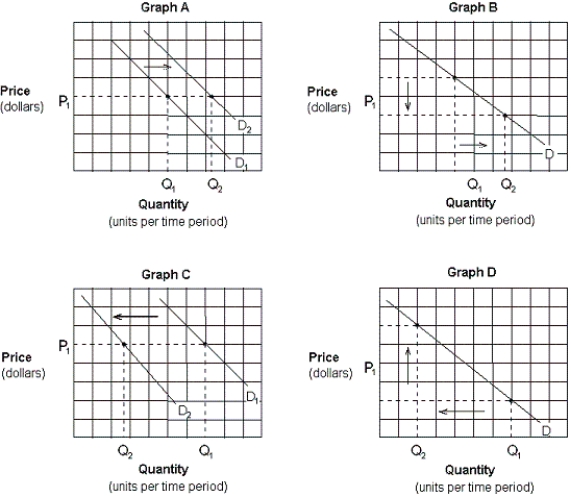
-Assume that consumers expect the price of gasoline to rise sharply in the future. Which of the graphs in Exhibit 3-3 depicts this effect?
A) Graph A.
B) Graph B.
C) Graph C.
D) Graph D.
Correct Answer:

Verified
Correct Answer:
Verified
Related Questions
Q1: When economists say the supply of a
Q2: Other things being equal, the effect of
Q3: Exhibit 3-13 Supply and demand curves
Q4: The law of demand states that, ceteris
Q8: Assuming that hamburgers and hot dogs are
Q10: Two goods that are complementary are:<br>A) wrapping
Q11: Assume that crackers and soup are complementary
Q12: Suppose A and B are substitute goods.
Q18: When economists say the quantity demanded of
Q166: Assume Q<sub>s</sub> represents the quantity supplied at